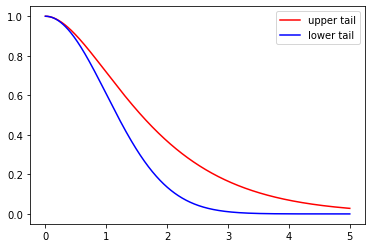
Plot of chernoff bound
Contents
Plot of chernoff bound
Visulization of upper and lower tail of chernoff bound
import numpy as np
import matplotlib.pyplot as plt

%matplotlib inline
x1 = np.linspace(0, 5, 1000)
x2 = np.linspace(0, 5, 1000)
y1 = np.exp(-(x1 * x1) / (x1 + 2))
y2 = np.exp(-x2 * x2 / 2)
fig = plt.figure()
ax = fig.add_subplot()
upper = ax.plot(x1, y1, "r")
lower = ax.plot(x2, y2, "b")
x = np.concatenate((x1, x2))
ax.set_xticks(np.arange(min(x), max(x) + 1, 1))
ax.legend(["upper tail", "lower tail"])
plt.savefig(
    "../assets/2022_01_14_chernoff_bound/chernoff_tails.png", bbox_inches="tight"
)
plt.show()

